Viewing Dives
The Dives tab shows all your downloaded dives sorted by date, with the most recent dives at the top. Each entry in the list displays the dive number, date, duration, max depth, and the device it was downloaded from.
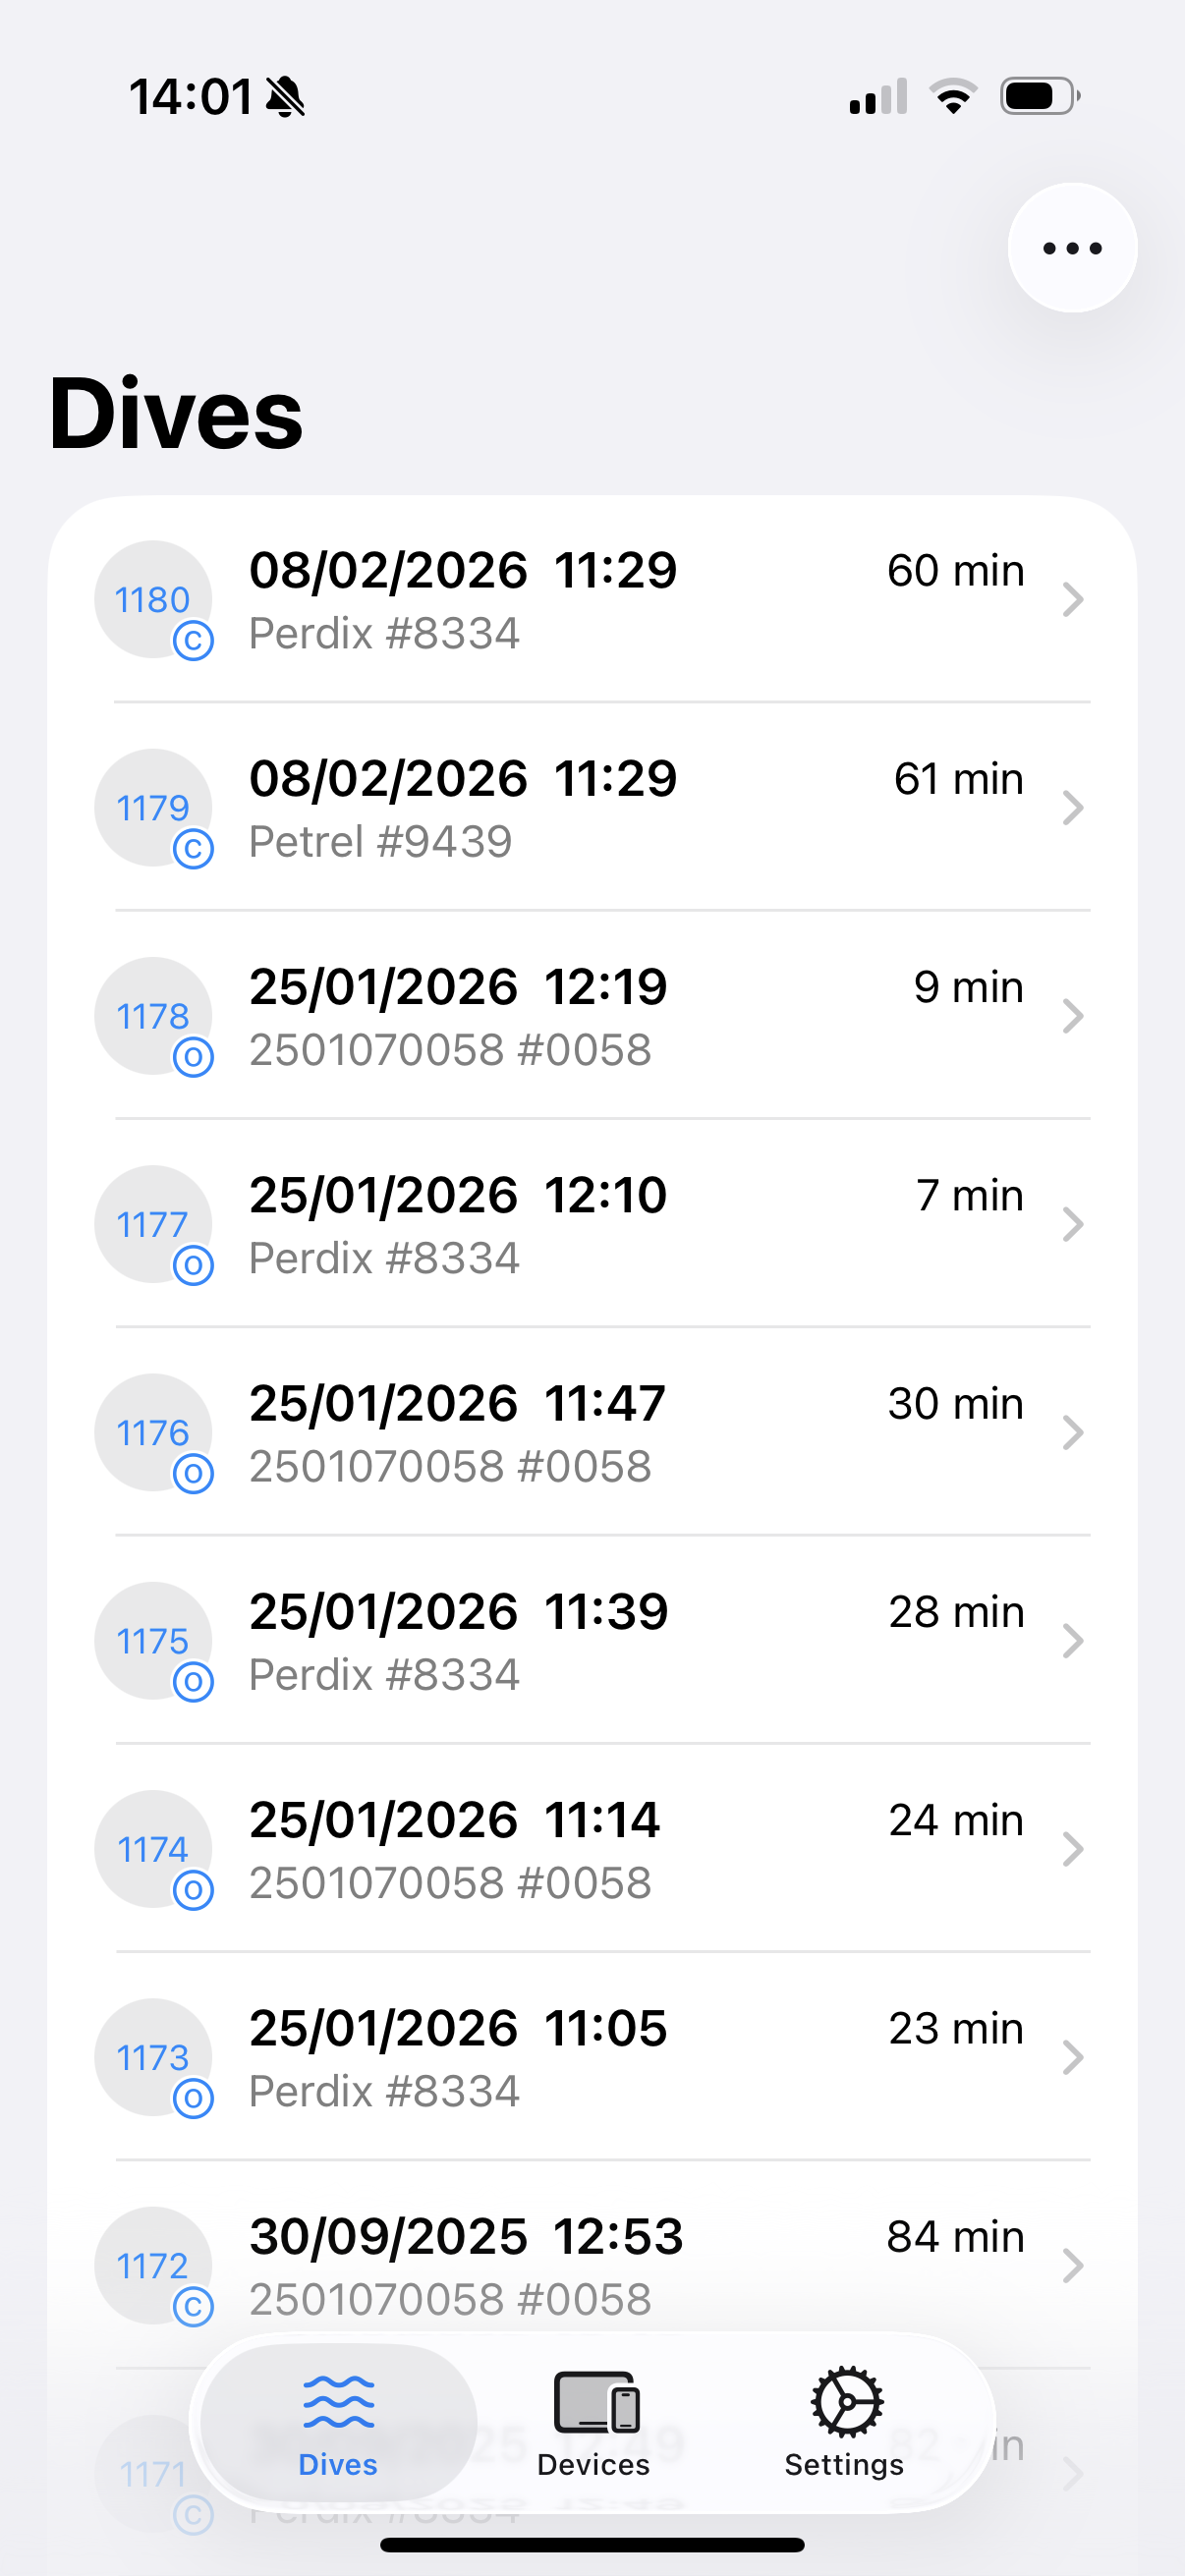
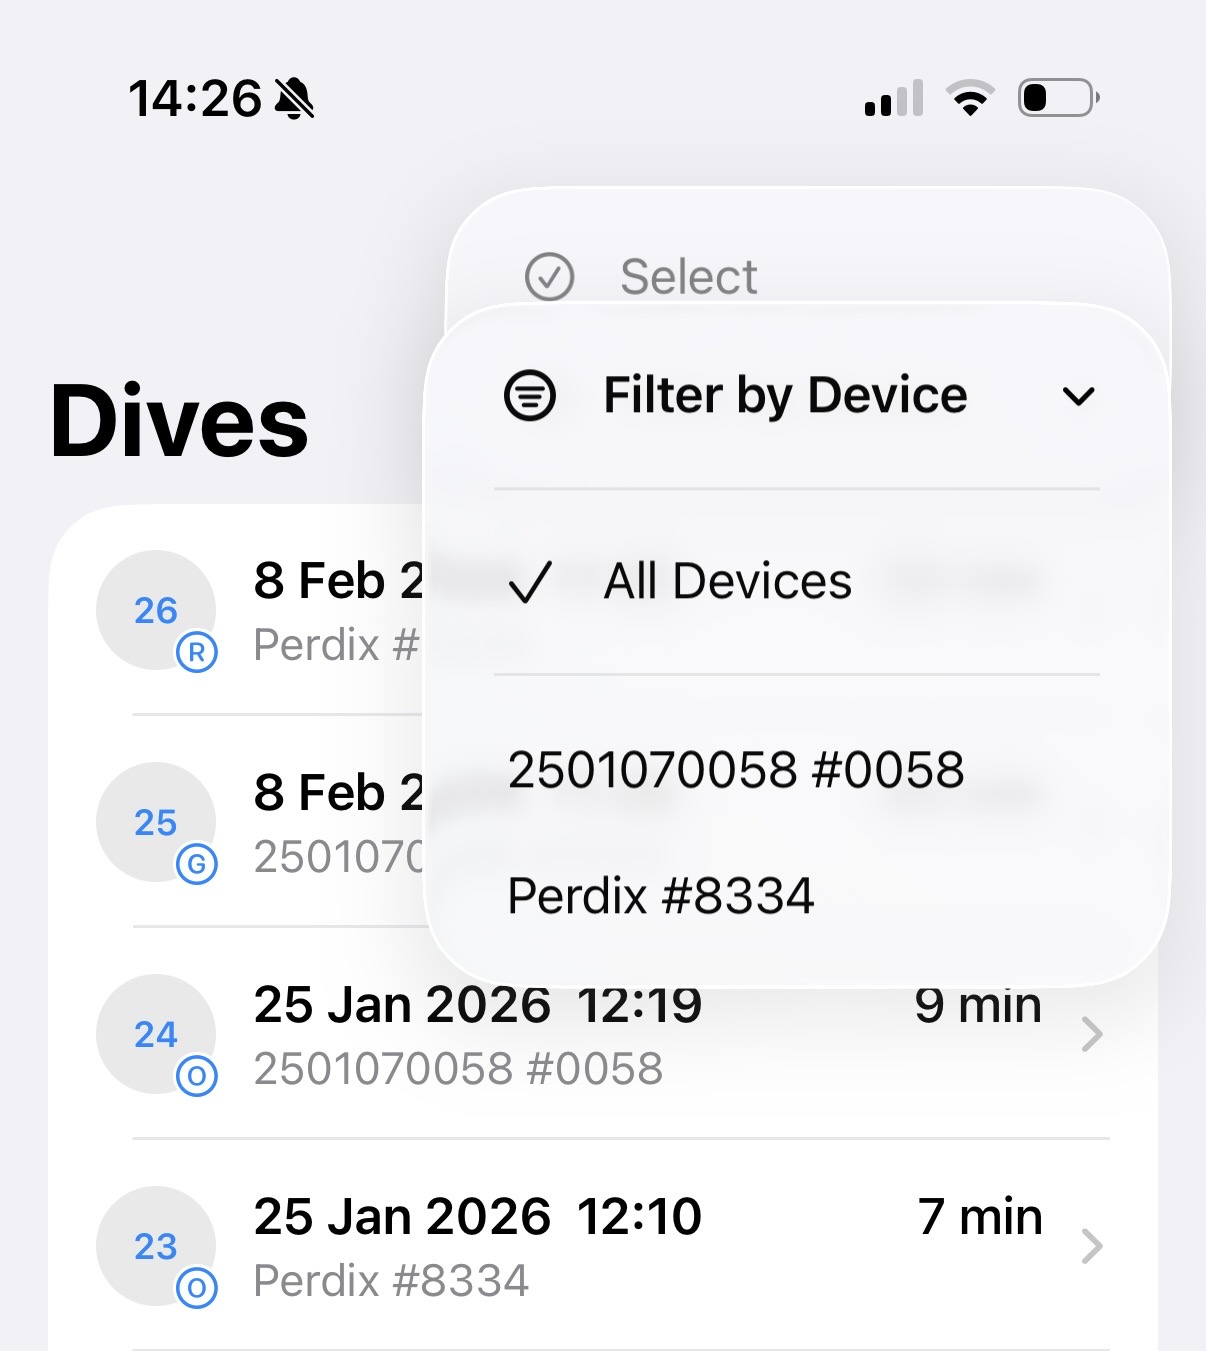
Tap the more menu (three dots) in the top-right corner to access additional options, including filtering by device and entering multi-select mode.
Tap any dive to open the full dive detail view. The share icon in the top-right corner lets you export the dive as a UDDF file.
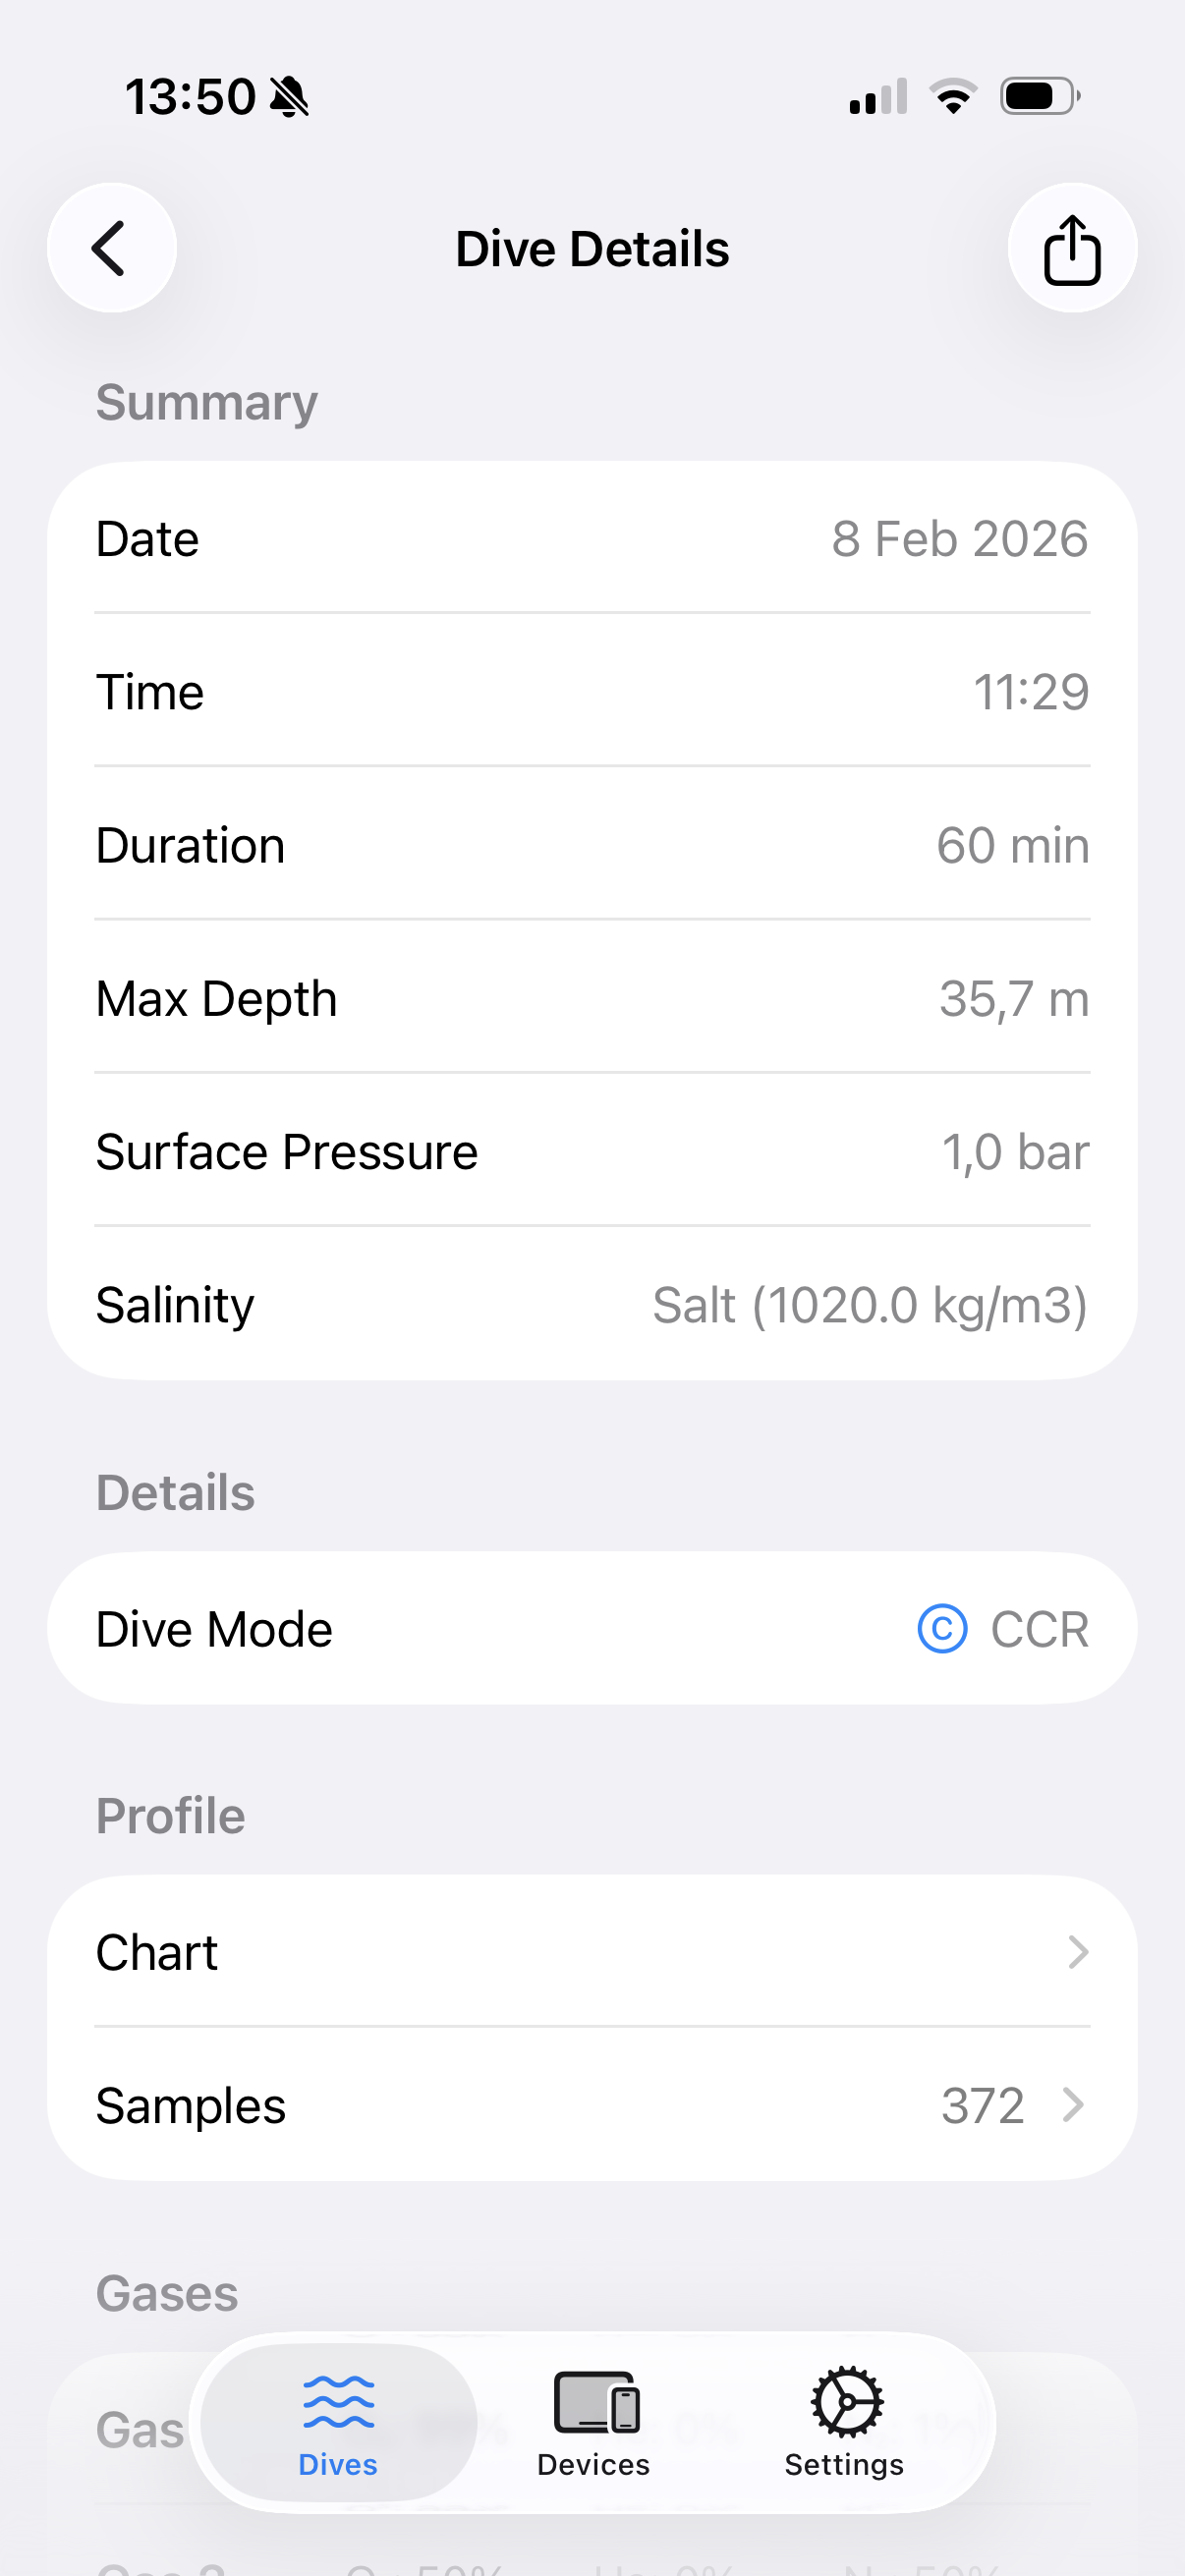
Summary
The summary section shows the key facts about your dive:
- Date and Time — When the dive started
- Duration — Total dive time
- Max Depth — Deepest point reached
- Average Depth — Mean depth over the dive (if recorded)
- Temperature — Surface, minimum, and maximum temperatures
- Surface Pressure — Atmospheric pressure at the surface
- Salinity — Fresh water or salt water, with density if available
Location
If your dive computer records GPS data, this section shows:
- Coordinates — Latitude and longitude
- Altitude — Elevation of the dive site
Device
Shows which dive computer recorded the dive:
- Device name, vendor, and model
- Serial number and firmware version
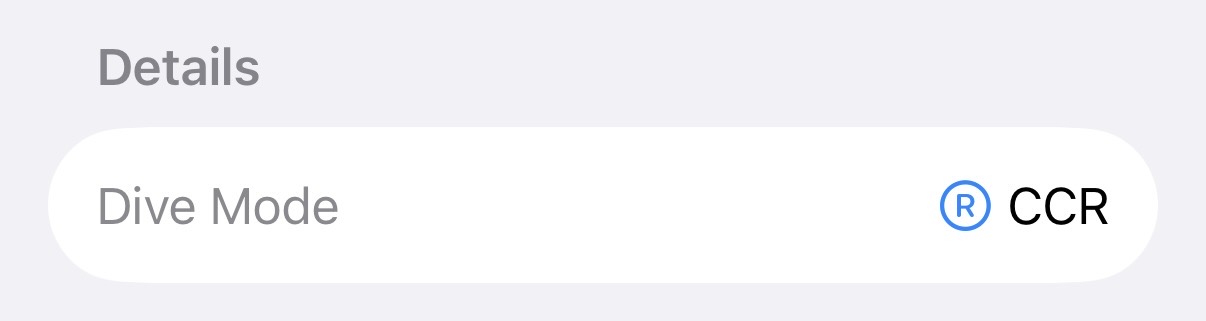
Dive Mode
The type of dive performed:
- Open Circuit (OC)
- Closed-Circuit Rebreather (CCR)
- Semi-Closed Rebreather (SCR)
- Gauge
- Freedive
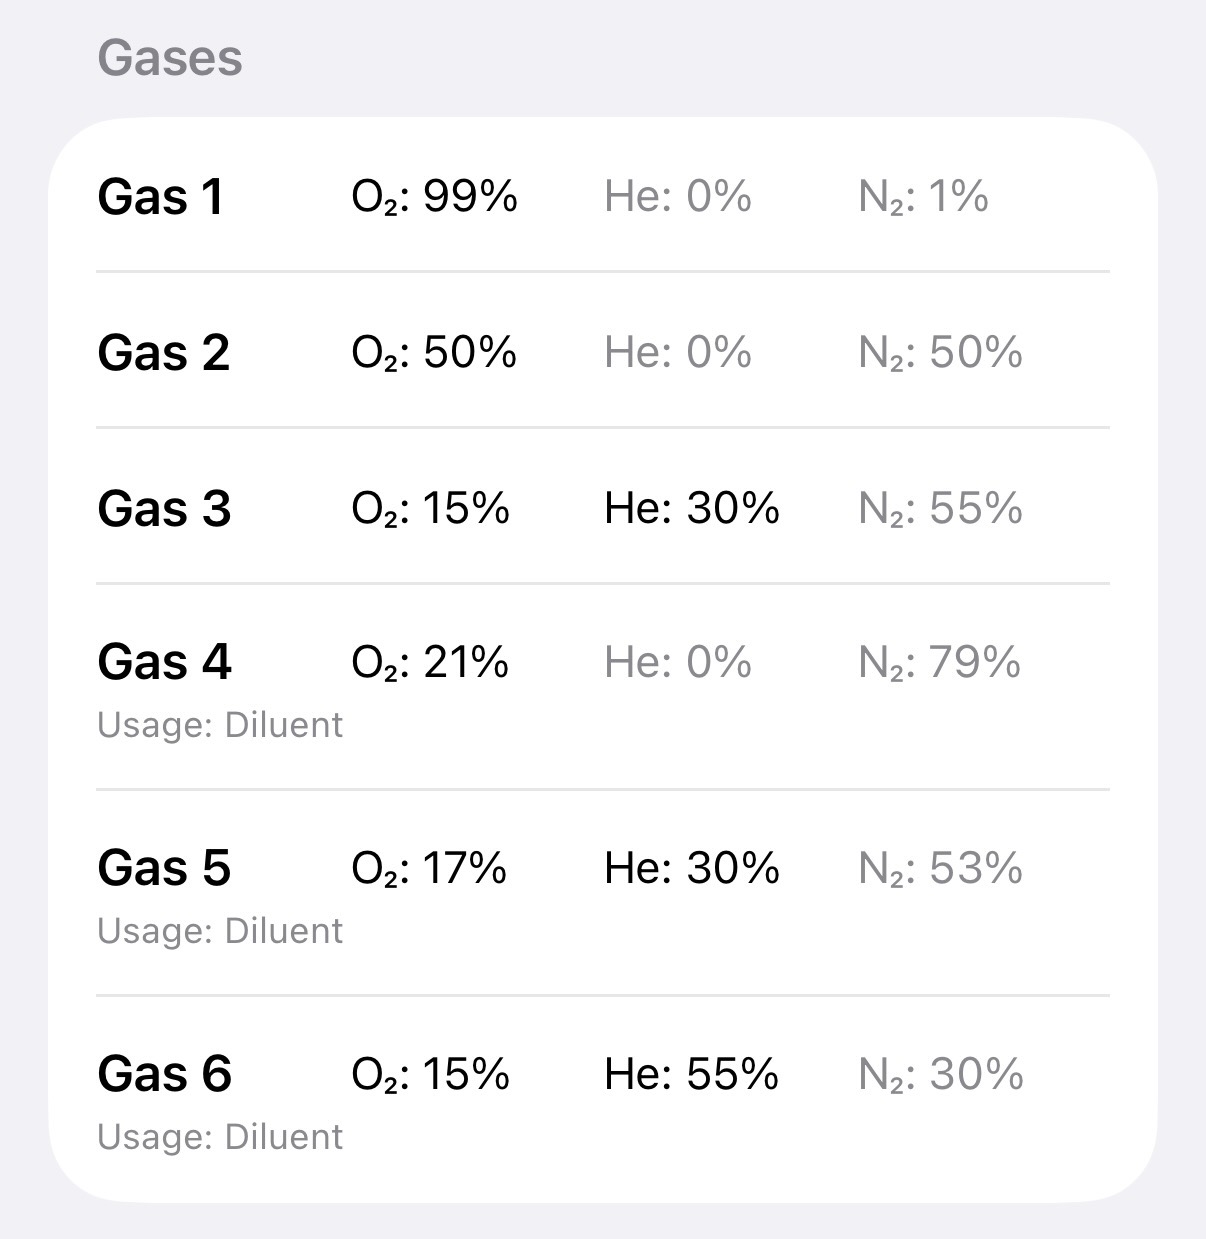
Gases
Lists all gas mixes used during the dive. For each gas:
- O2 — Oxygen percentage
- He — Helium percentage (for trimix)
- N2 — Nitrogen percentage
- Usage — How the gas was used (e.g., bottom gas, deco, diluent, bailout)
Tanks
Shows tank information when available:
- Tank number and associated gas mix
- Tank volume and working pressure
- Start and end pressure
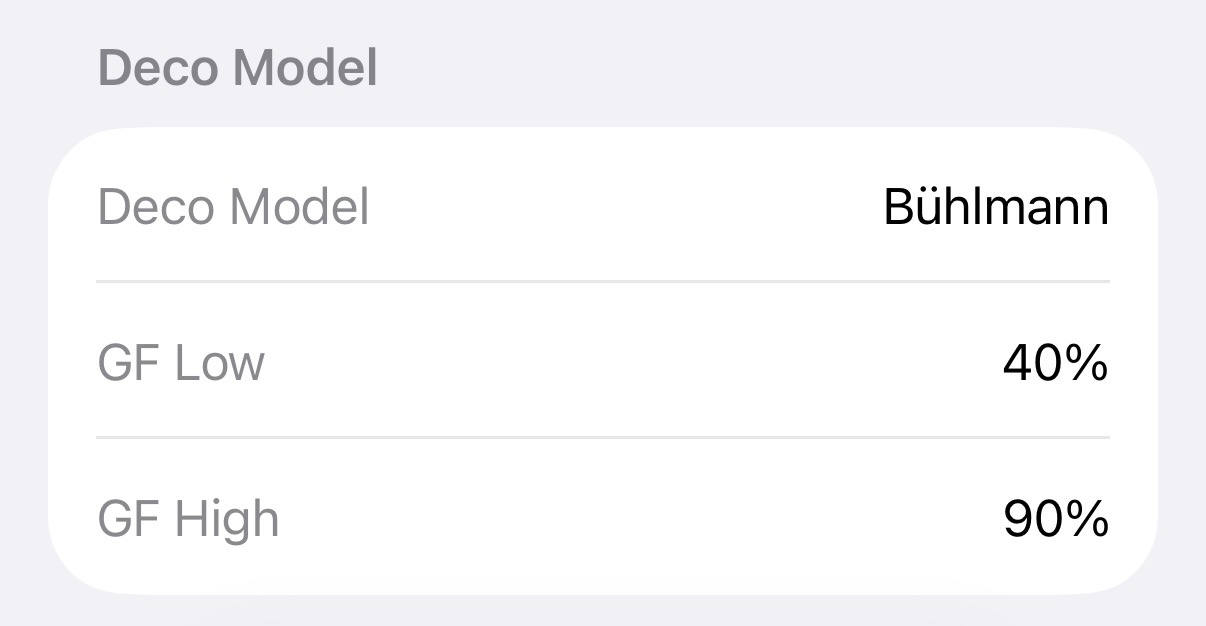
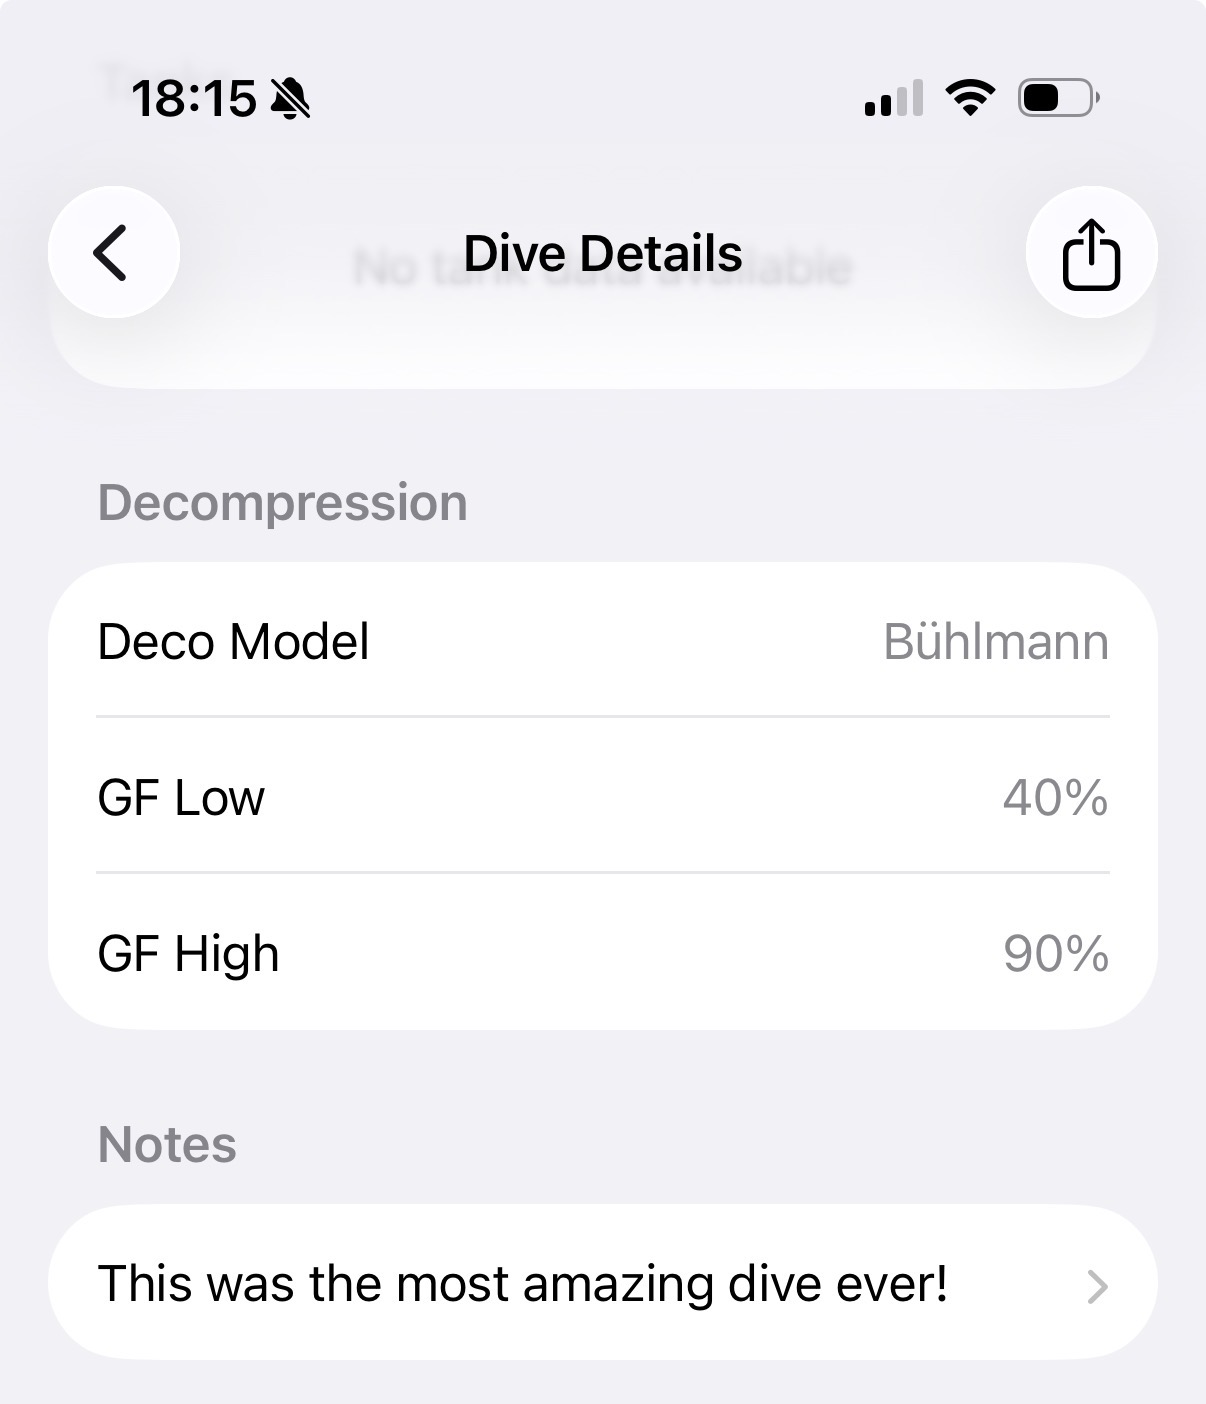
Decompression
If your dive computer records decompression model settings:
- Model type — Buhlmann, VPM, RGBM, DCIEM, or none
- Gradient Factors — GF Low and GF High (for Buhlmann)
- Conservatism — Level setting (for VPM)
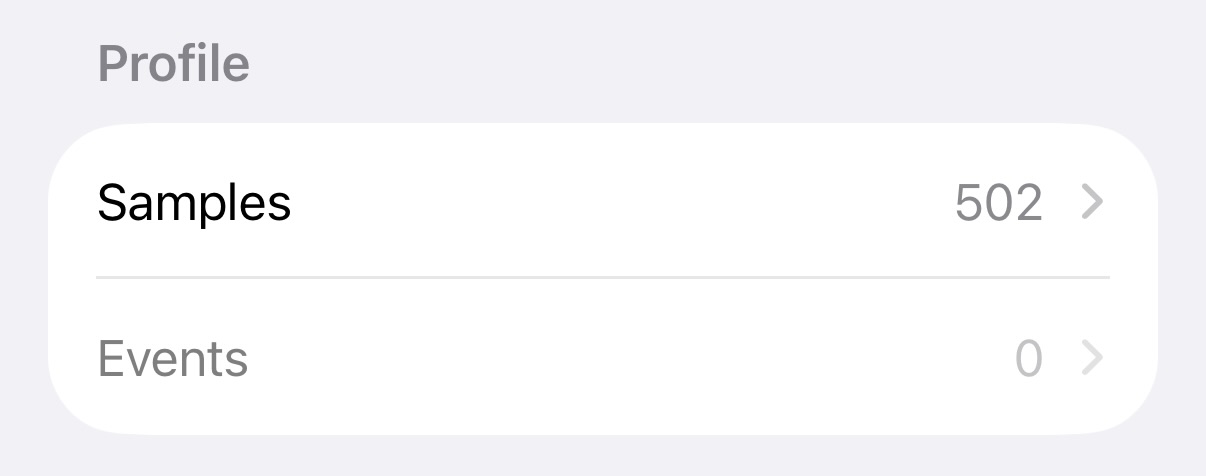
Profile
The profile section provides access to the detailed sample-by-sample data recorded during the dive.
Chart
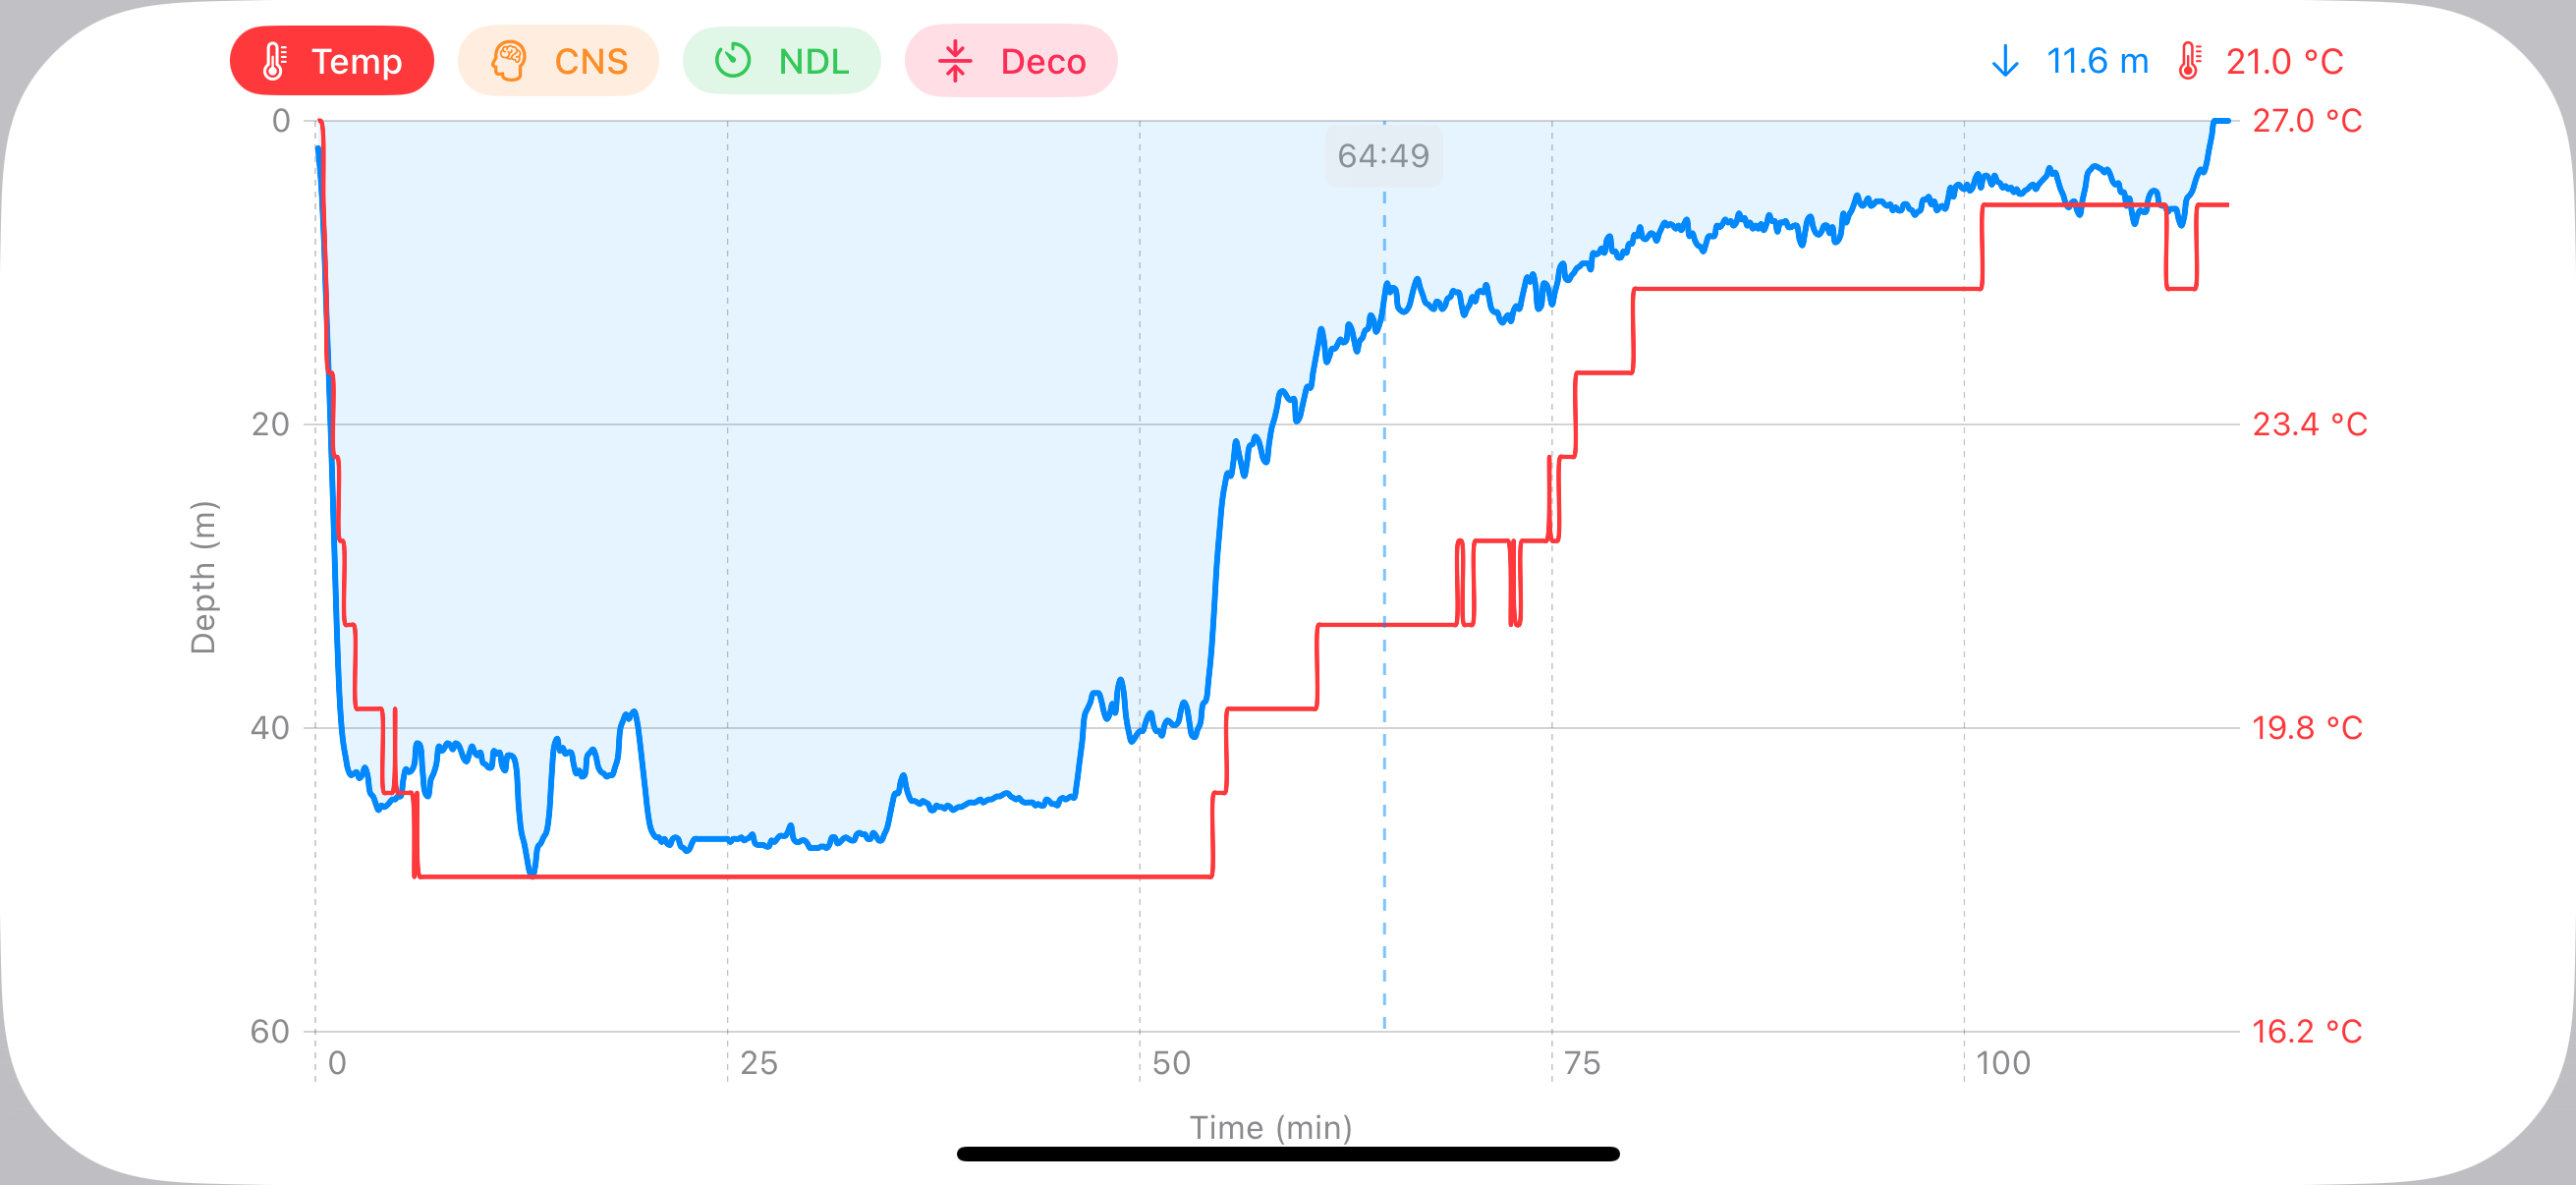
Tap Chart to view an interactive dive profile chart. The chart plots depth over time as a blue area curve, with the X-axis showing elapsed time in minutes and the Y-axis showing depth.
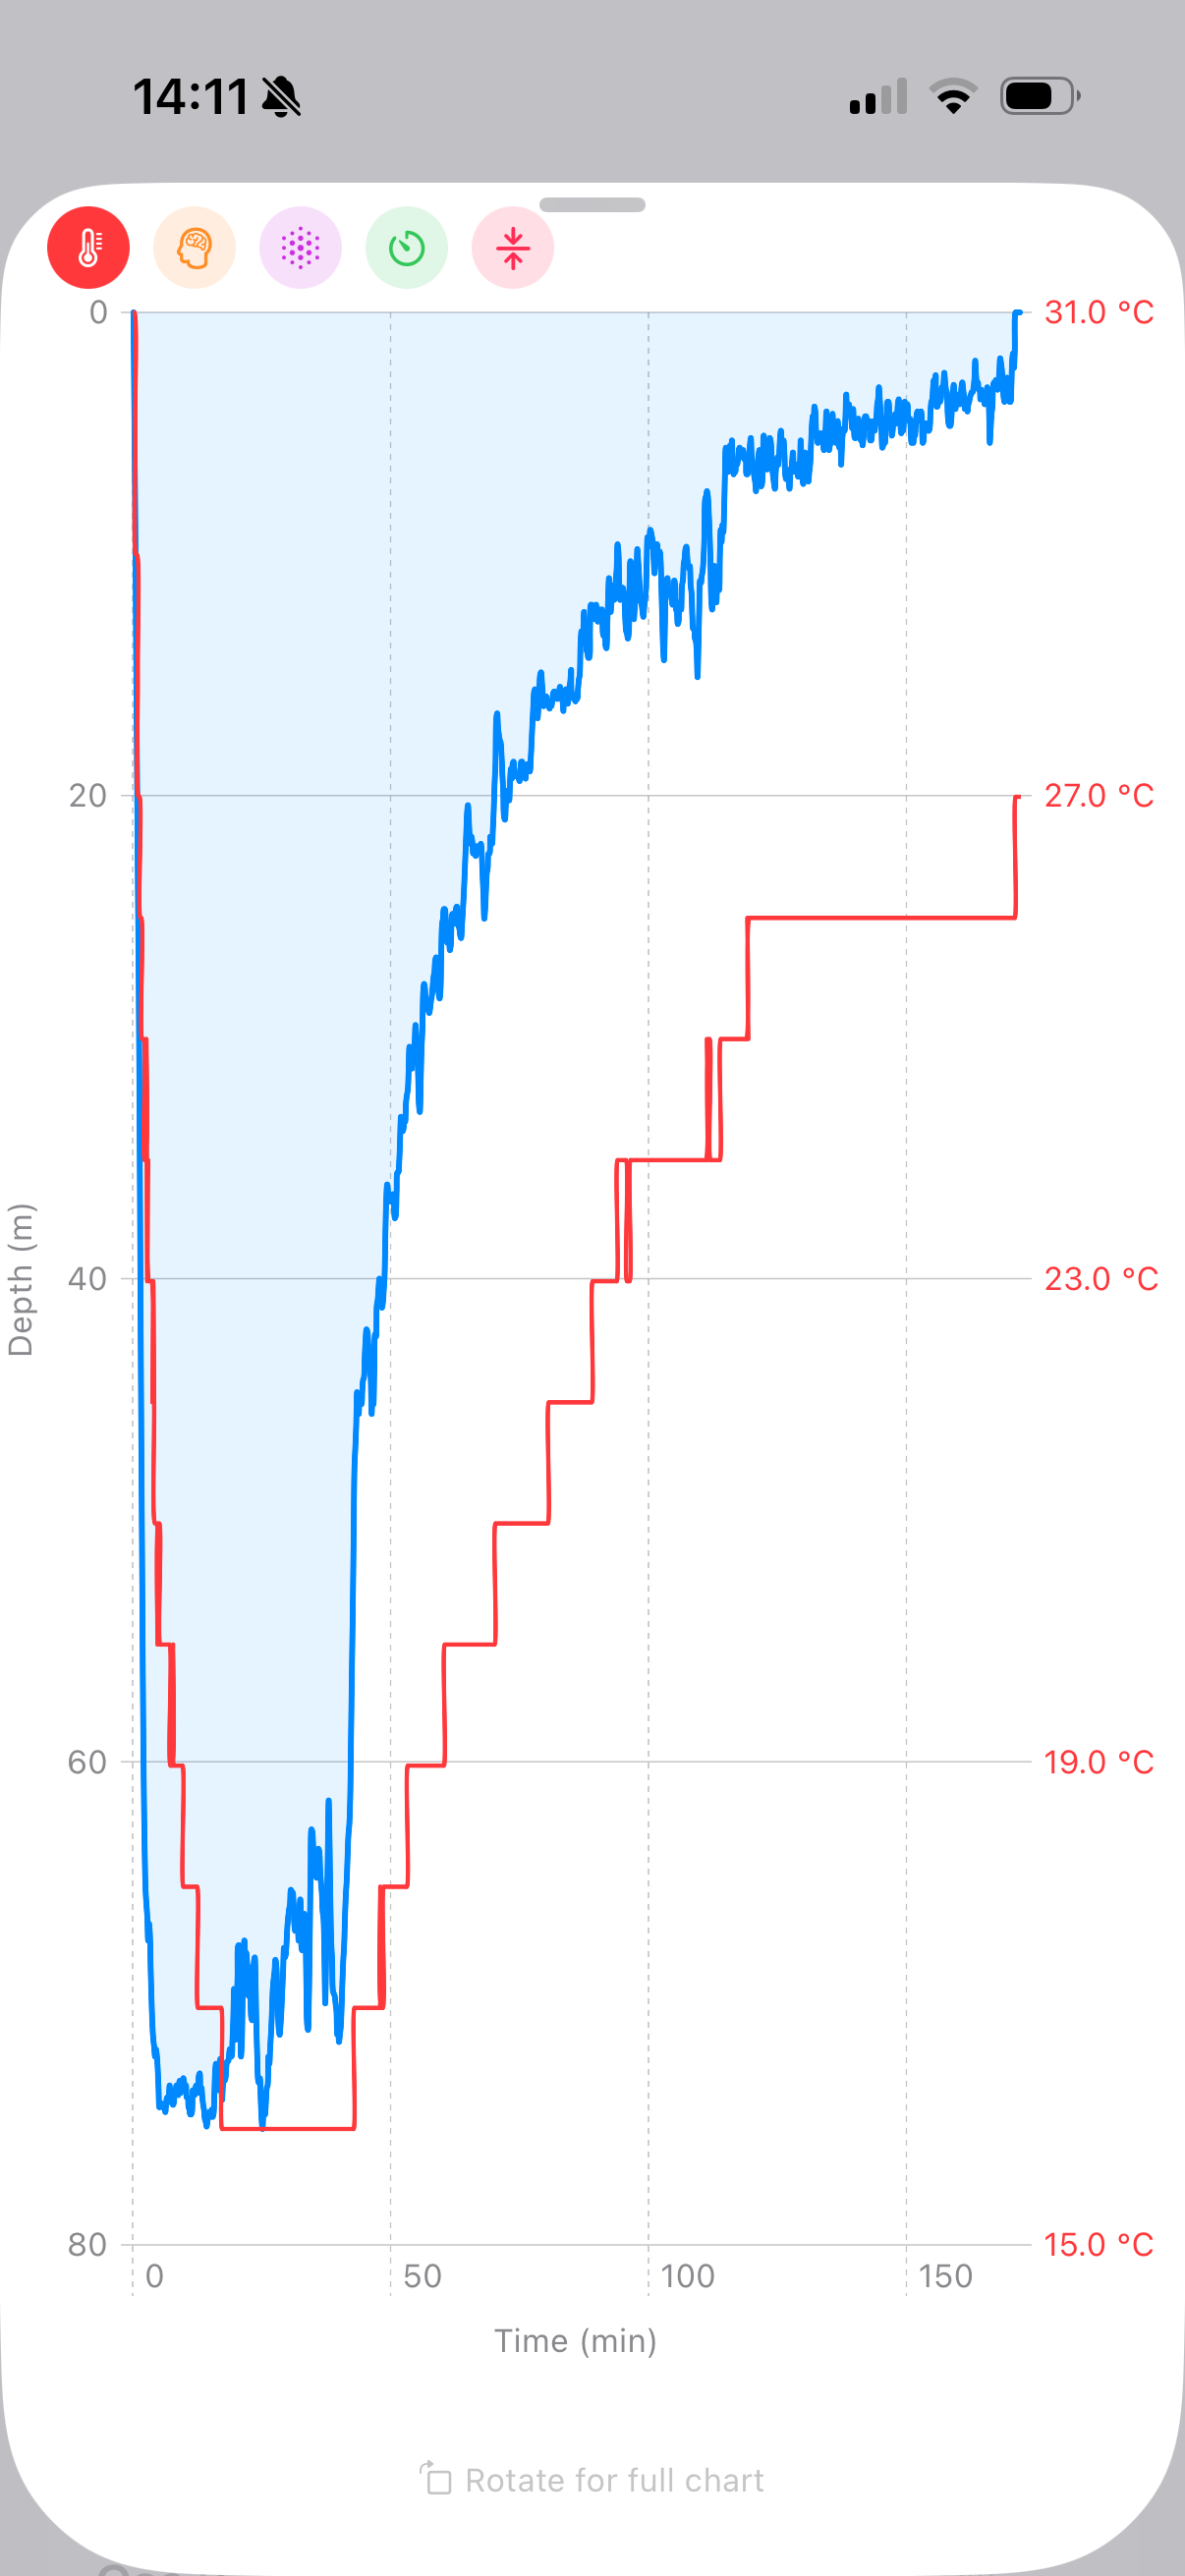
You can toggle additional data overlays using the buttons at the top of the chart:
- Temp — Water temperature throughout the dive, shown as a red line
- CNS — Central Nervous System oxygen toxicity percentage
- PPO₂ — Partial pressure of oxygen
- NDL — No-Decompression Limit remaining (in minutes). Drops to zero when decompression is required.
- Deco — Decompression stop depth, shown as shaded rectangles when the dive enters decompression
When an overlay is active, its values appear on the secondary axis on the right side of the chart.
Tap and drag across the chart to inspect individual data points. A vertical marker shows the exact time, and the selected values are displayed at the top of the chart.
Rotate your device to landscape for a full-width view of the chart with expanded controls and labels.
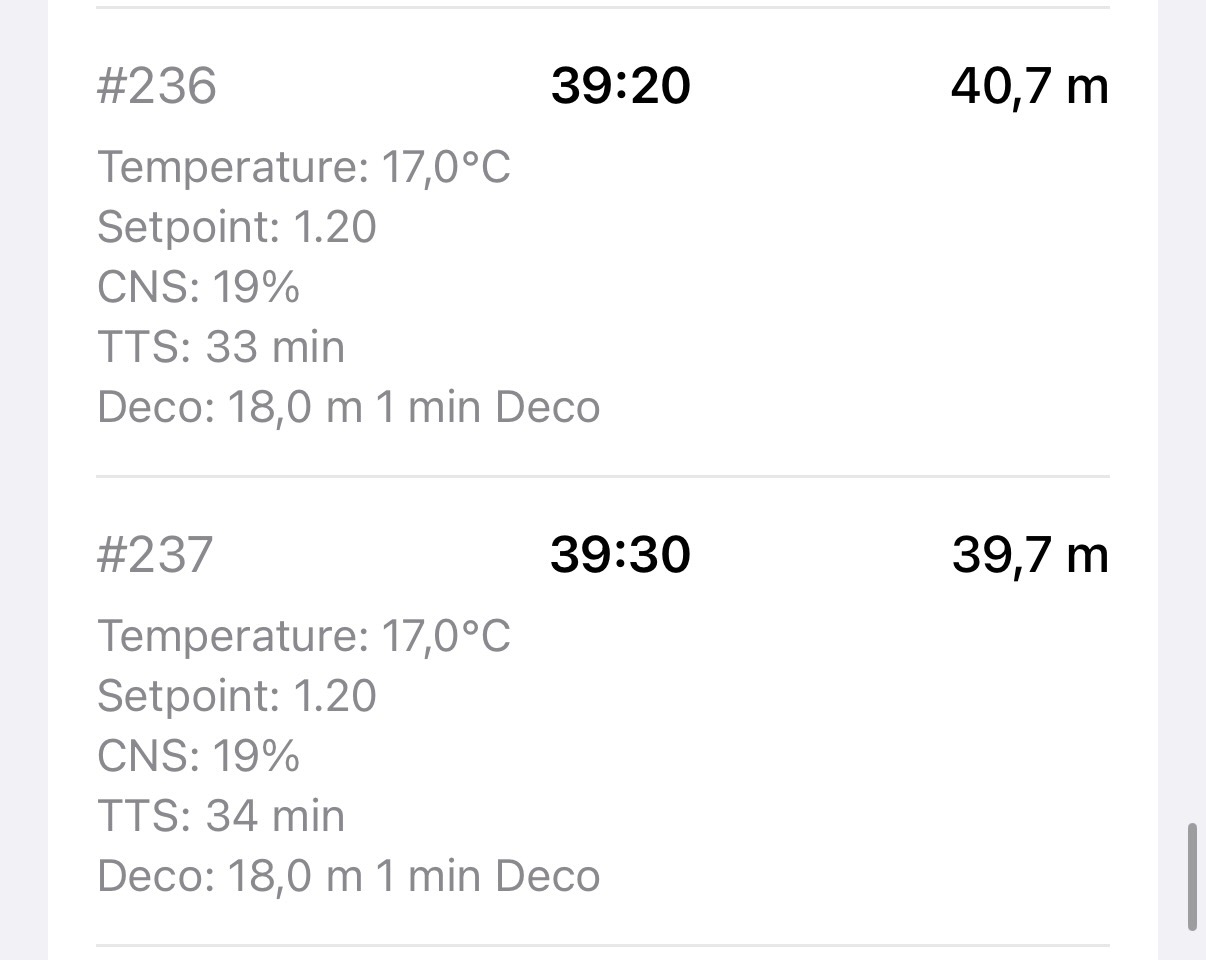
Samples
Tap Samples to view the full dive profile. Each sample includes data points such as:
- Time offset and depth
- Temperature and tank pressure
- Remaining Bottom Time (RBT)
- Heart rate and compass bearing (if supported)
- PPO2 and CNS oxygen toxicity percentage
- NDL (No-Decompression Limit) or TTS (Time To Surface)
- Deco stop information (depth and time)
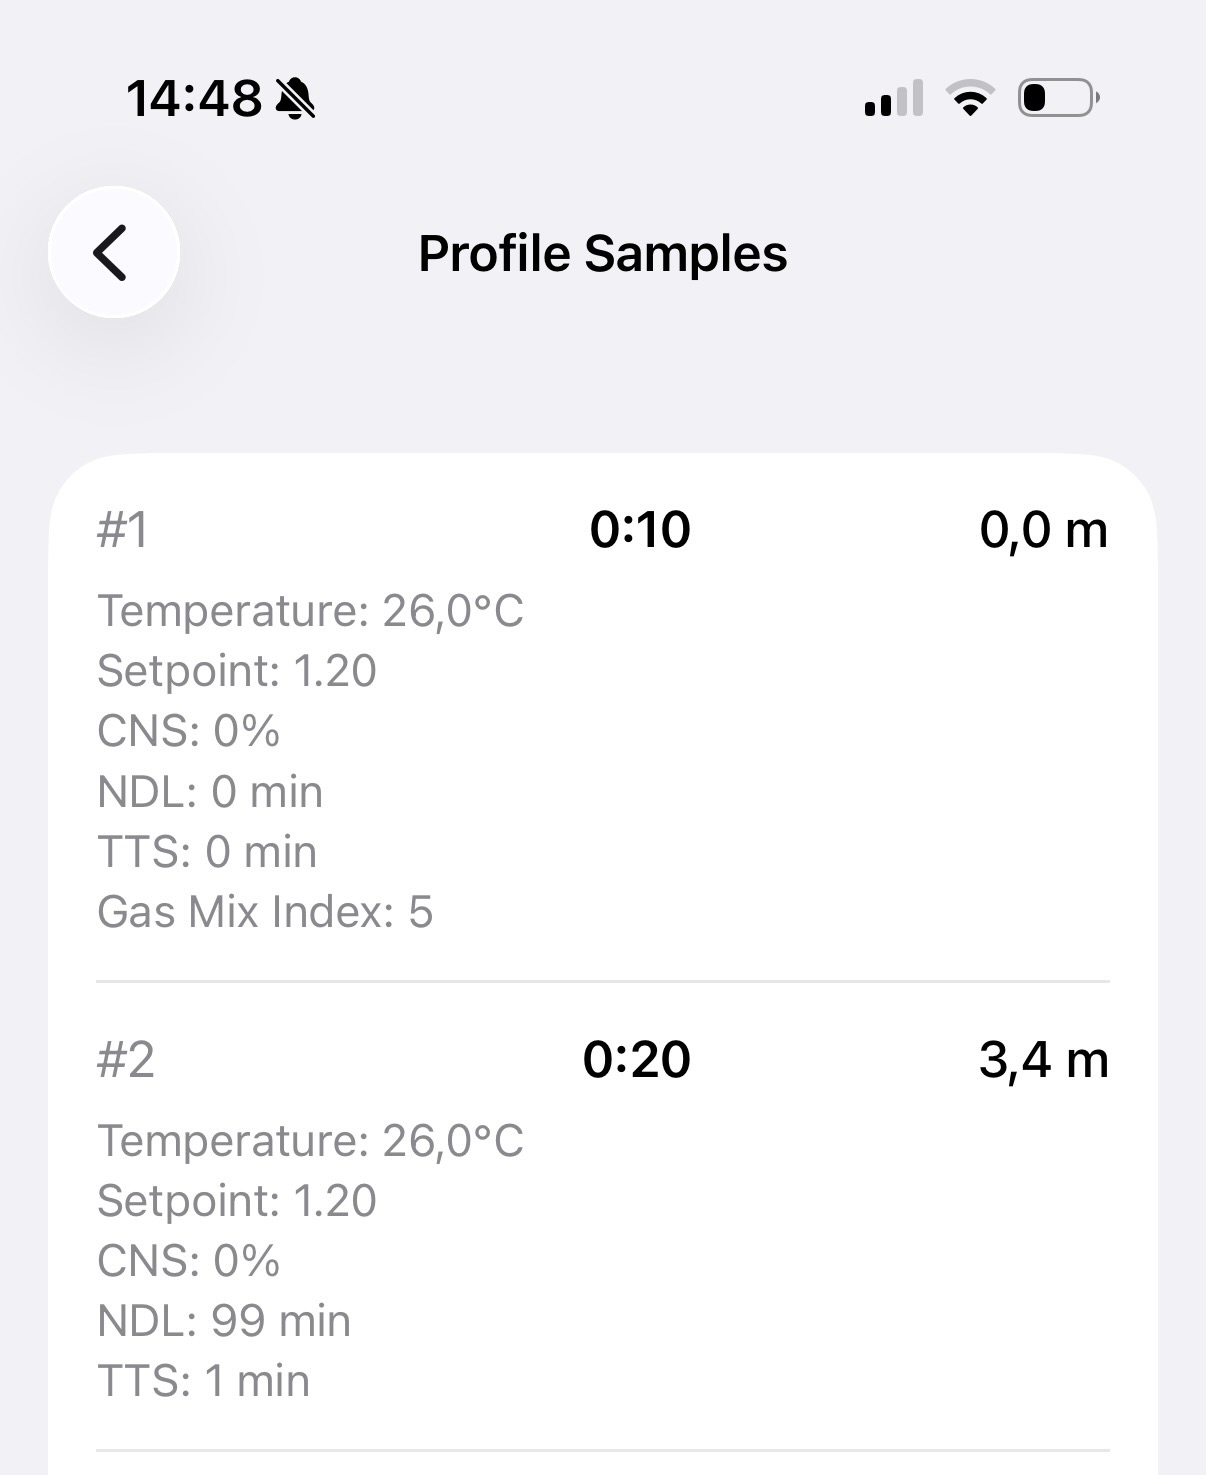
During decompression dives, samples also show deco stop depth and time.
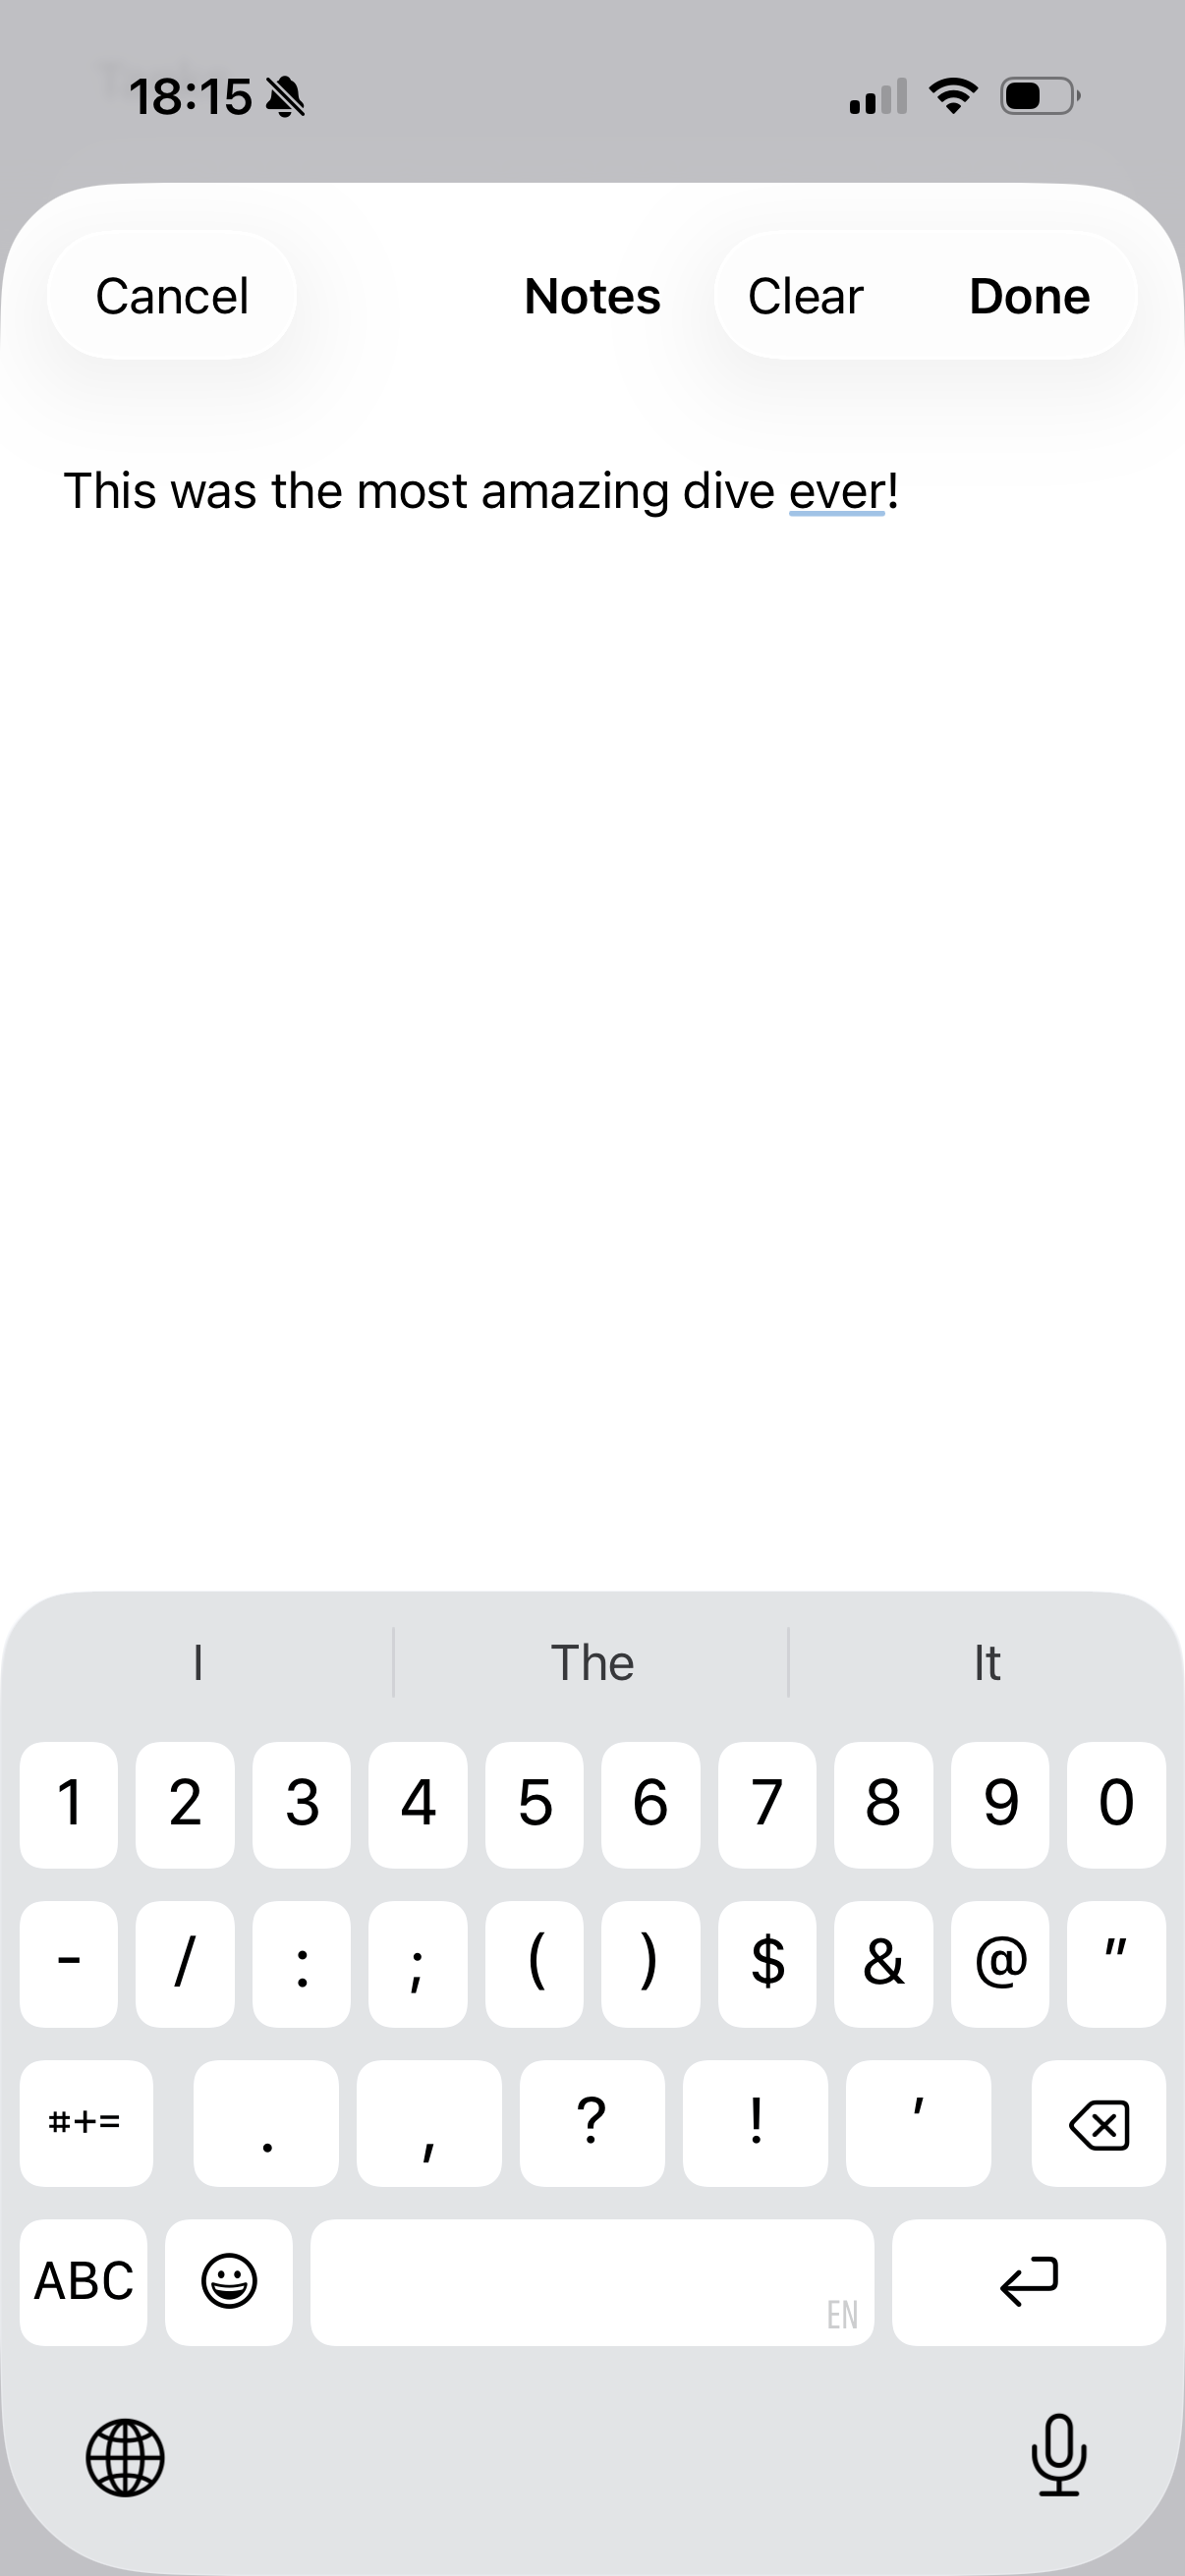
Notes
The Notes section lets you add your own text to a dive, such as conditions, marine life, or anything else worth recording. It shows your saved note, or an empty field when no note has been added yet.
Tap the note to open the editor, type your note, then tap Done to save it. Clear removes the text, and Cancel discards your changes.
Your notes are included when you export the dive as UDDF, so they travel with your dive data to the logbook of your choice.